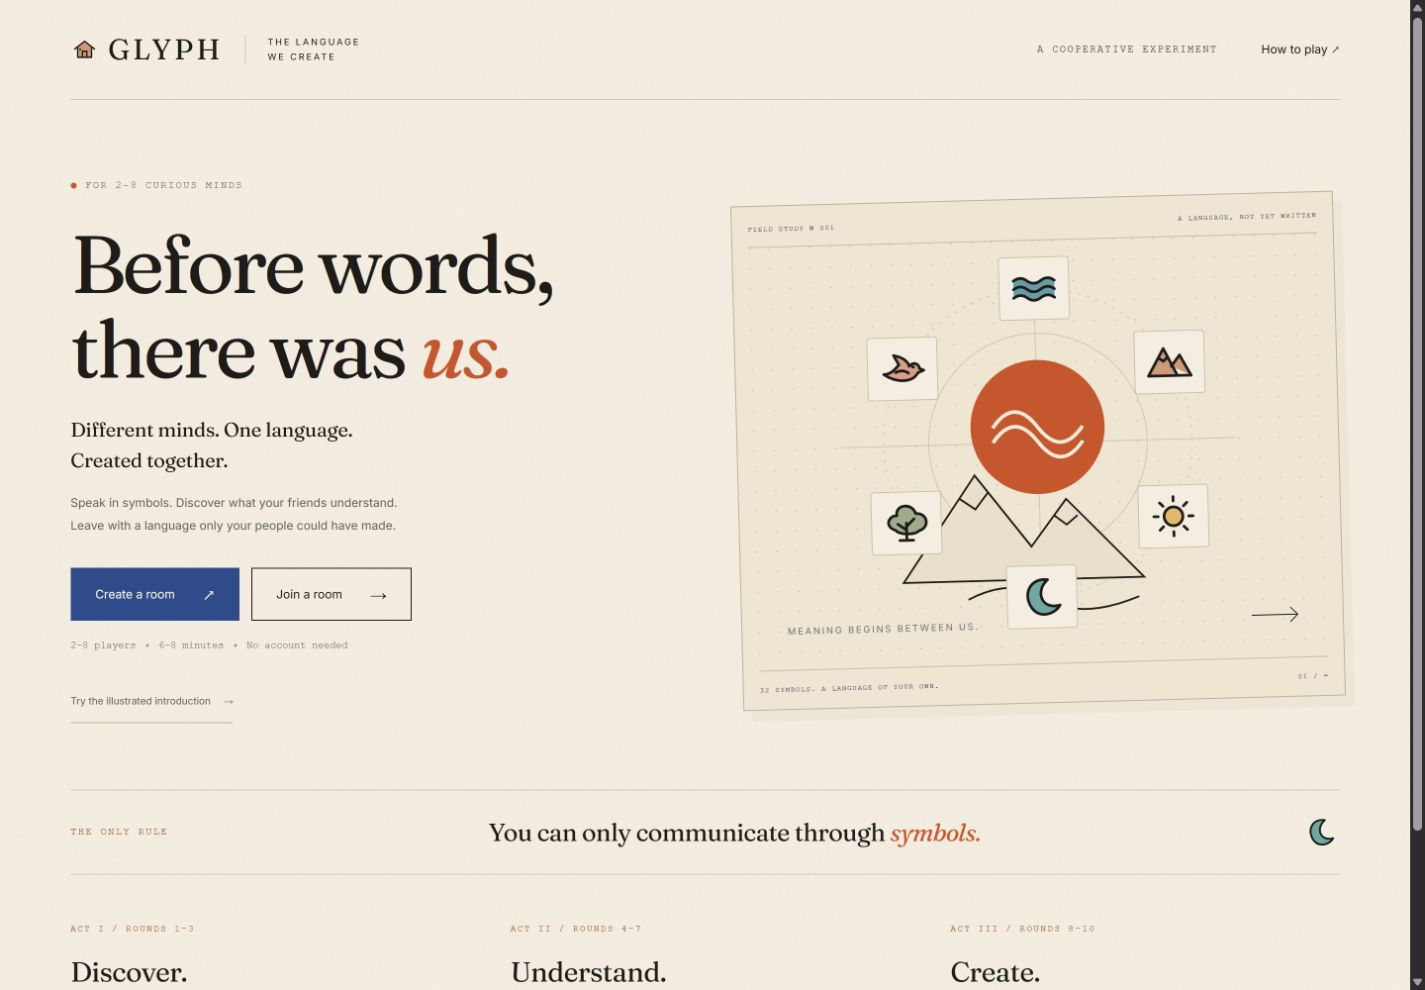
Play Glyph ↗Opens the public gameplay page. Two players required.
Developed by Olivia Chikunichawa under Liv AI Consulting, Glyph invites two to eight players to build a shared symbolic language.
A speaker sends one to three ordered symbols. Listeners interpret the message and confirm a scene. Ten rounds move through Discover, Understand and Create, with standard or relaxed timing.
Draft messages can be edited before sending. Listener choices can be changed before confirmation. The team works towards 70 points out of 100.
Glyph is an interactive language and symbol-based game developed as part of Liv AI Consulting's digital solutions portfolio. Explore symbol combinations, solve engaging challenges and experience interactive problem-solving.
Screenshot of the existing Glyph application. Play with at least two people.
AI-Powered Business Intelligence
Liv InsightsDeployed
From uploaded datasets to insights you can understand and act on.
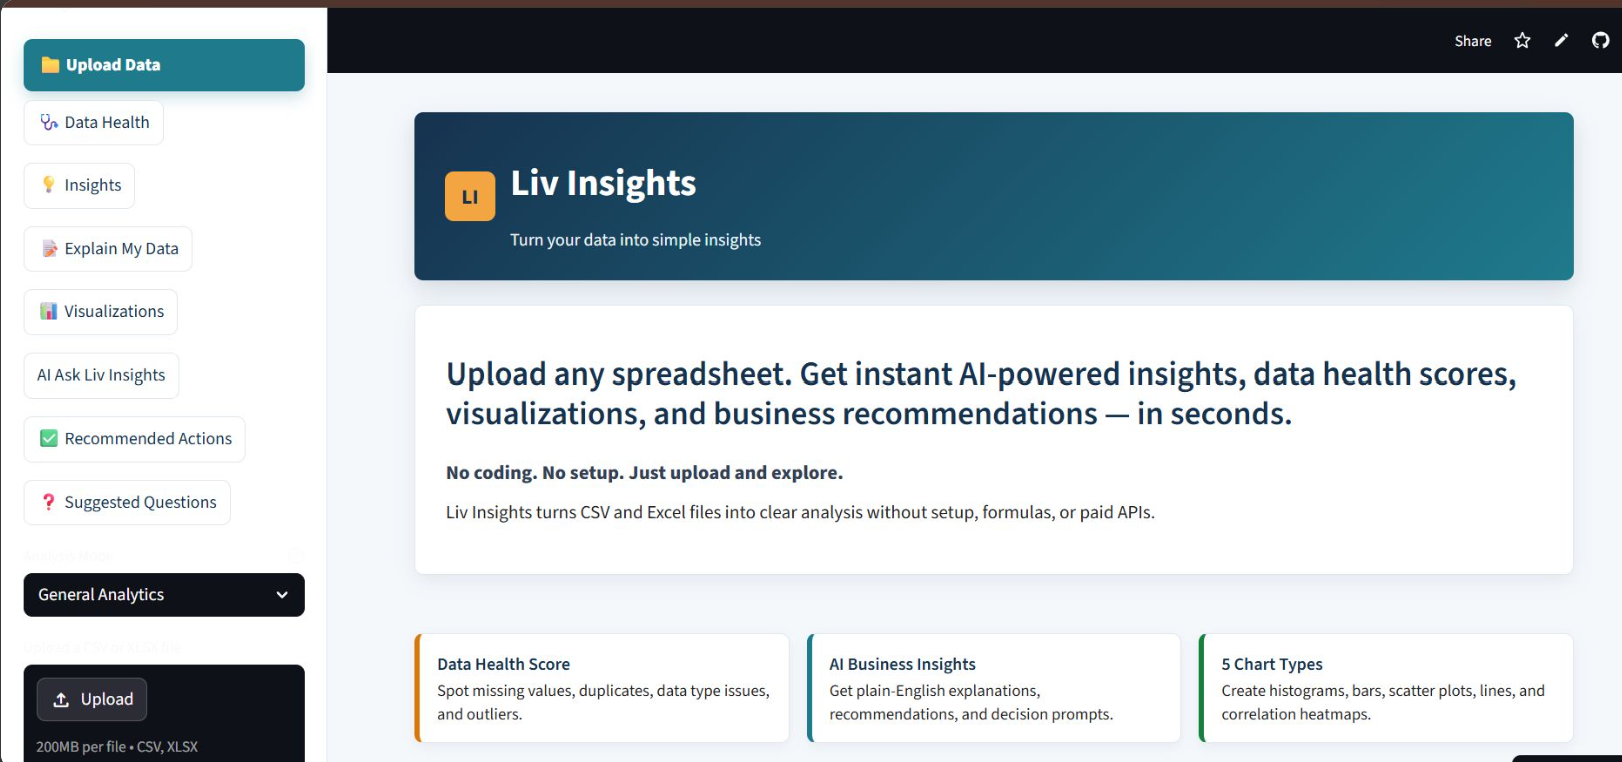
Liv Insights turns uploaded CSV and Excel datasets into understandable insights, visualisations, and actionable recommendations for business owners, managers, executives, and non-technical decision-makers.
Liv Insights · Application preview
Authentic application screenshot provided by the founder.Analysis requires human review; processing speed and accuracy vary.View full size (opens in a new tab)↗
The business problem
Too much preparation. Too little clarity.
Organisations spend too much time understanding and preparing data before making decisions. Complex datasets can make useful analysis difficult to access for non-technical decision-makers.
The solution
Make data useful for business decisions.
Upload a CSV or Excel dataset, explore its health, and work through understandable insights, visualisations, and recommendations. Ask questions in natural language and choose an analysis mode that fits your context.
Designed for
People who need to make decisions.
Business owners, managers, executives, and non-technical decision-makers who want to understand their datasets and identify practical next steps.
Inside the application
Understand. Explore. Ask. Act.
Tools to connect data exploration with practical business questions.
Data health scoring
Assess missing values, duplicates, data types, and outliers before interpreting your data.
AI business insights
Explore plain-language explanations and business insights from the uploaded dataset.
Five visualisation types
Histograms, bar charts, scatter plots, line charts, and correlation heatmaps.
Recommended actions
Review suggestions that connect analysis with potential business decisions.
Suggested questions
Find prompts to explore your dataset and develop a deeper understanding.
Natural-language Q&A
Ask questions about your data using everyday language.
Context-aware analysis modes
Explore data through a mode aligned with your business context.
Analysis modes
A business lens for your data.
General Analytics
Business Analytics
Customer Insights
Financial Data
Marketing Analysis
Technology
Built with a practical data stack.
Python
Streamlit
Pandas
Plotly
OpenAI API
The development story
Built from a real analytical challenge.
Liv Insights was inspired by Olivia Chikunichawa’s experience working with complex datasets and the challenge of making analysis useful to non-technical decision-makers. It brings her business perspective and practical software development together around a clear question: how can data become more understandable and useful?
Use insights with judgement.
Results depend on the dataset, its quality, and the analysis context. AI-generated interpretations and recommended actions should be checked before informing decisions. The screenshot reflects the application interface; no instant-result or accuracy guarantee is made here.